Load kubernetes contexts:
export CTX_CLUSTER1=k8s-1-admin@k8s-1
export CTX_CLUSTER2=k8s-2-admin@k8s-2
export CTX_CLUSTERHUB=k8s-hub-admin@k8s-hub
We will use Bitnami helm charts to deploy out stack, so let’s add the chart repository:
helm repo add bitnami https://charts.bitnami.com/bitnami
We have good documentation of how to this this in bitnami docs, but I will also document step by step here documenting the problems I have faced for this singular case.
We will deploy one Prometheus Operator for each workload cluster. In each workload cluster we will change the externalLabel of the cluster, so for workload cluster1 we can use k8s-1 and for workload cluster2 we can use k8s-2
kubectl --context="${CTX_CLUSTER1}" create namespace monitoring
helm install --kube-context="${CTX_CLUSTER1}" prometheus-operator -n monitoring \
  --set prometheus.thanos.create=true \
  --set operator.service.type=ClusterIP \
  --set prometheus.service.type=ClusterIP \
  --set alertmanager.service.type=ClusterIP \
  --set prometheus.thanos.service.type=LoadBalancer \
  --set prometheus.externalLabels.cluster="k8s-1" \
  bitnami/kube-prometheus

kubectl --context="${CTX_CLUSTER2}" create namespace monitoring
helm install --kube-context="${CTX_CLUSTER2}" prometheus-operator -n monitoring \
  --set prometheus.thanos.create=true \
  --set operator.service.type=ClusterIP \
  --set prometheus.service.type=ClusterIP \
  --set alertmanager.service.type=ClusterIP \
  --set prometheus.thanos.service.type=LoadBalancer \
  --set prometheus.externalLabels.cluster="k8s-2" \
  bitnami/kube-prometheus
This helm Chart will deploy Prometheus Operator along side with a Thanos sidecar that will export the metrics to our principal Thanos in the Hub.
kubectl get svc --context="${CTX_CLUSTER1}" -n monitoring | grep thanos
kubectl get svc --context="${CTX_CLUSTER2}" -n monitoring | grep thanos
Install and Configure Thanos on the Hub Cluster
For installing and configuring thanos on the Hub Cluster, we will use the file we have located at monitoring/values.yaml in the repo:
cat values.yaml
objstoreConfig: |-
  type: s3
  config:
    bucket: thanos
    endpoint: .monitoring.svc.cluster.local:9000
    access_key: minio
    secret_key: KEY
    insecure: true
querier:
  stores:
    - SIDECAR-SERVICE-IP-ADDRESS-1:10901
    - SIDECAR-SERVICE-IP-ADDRESS-2:10901
bucketweb:
  enabled: true
compactor:
  enabled: true
storegateway:
  enabled: true
ruler:
  enabled: true
  alertmanagers:
    - http://prometheus-operator-alertmanager.monitoring.svc.cluster.local:9093
  config: |-
    groups:
      - name: "metamonitoring"
        rules:
          - alert: "PrometheusDown"
            expr: absent(up{prometheus="monitoring/prometheus-operator"})
minio:
  enabled: true
  accessKey:
    password: "minio"
  secretKey:
    password: "KEY"
  defaultBuckets: "thanos"
We have noticed that there is a bug in the values.yaml file, as you are supposed to change the KEY value and set you preferred password. However thanos is being installed always with the same user and random password. So what we will do is installing Thanos in Hub Cluster:
kubectl --context="${CTX_CLUSTERHUB}" create namespace monitoring
helm install --kube-context="${CTX_CLUSTERHUB}" thanos bitnami/thanos -n monitoring \
  --values monitoring/values.yaml
And you will see that thanos-storegateway-0 pod is having the following error:
The access key ID you provided does not exist in our records
This is because the values for thanos password in values.yaml file are not being taken, because a random password has been generated and the pod is not able to access with proper credentials.
For getting the actual password you would need to check it with the following command:
k get secret -n monitoring thanos-minio -o yaml -o jsonpath={.data.root-password} | base64 -d
Substitute this password by KEY in your values.yaml file, and upgrade the helm chart:
helm upgrade --kube-context="${CTX_CLUSTERHUB}" thanos bitnami/thanos -n monitoring \
  --values monitoring/values.yaml
You should see all the pods ap and running now. You can verify the status of the sidecar Thanos endpoints from the UI in Stores tab:
k port-forward -n monitoring svc/thanos-query 9090

Install and Configure Grafana
Use the following command to install Grafana on the Hub cluster:
helm install --kube-context="${CTX_CLUSTERHUB}" grafana bitnami/grafana \
  --set service.type=LoadBalancer \
  --set admin.password=<GRAFANA-PASSWORD> --namespace monitoring
Once the pod is up and running, access Grafana from the UI and add Prometheus as Data Source with the following URL:
http://thanos-query.monitoring.svc.cluster.local:9090
Click Save and Test and you should get a message in green saying that Data source is working.
Now you can import Grafana Dashboards to view the scraped metrics, this step is not necessary but it is good for testing everything was done ok.
We recommend you adding the open source istio grafana dashboards, if you import them at this moment you won’t be able to see any metrics, but when you complete next step, you can come back and test.
Add PodMonitor and ServiceMonitor to scrape Istio Metrics
We have added in this repo a file with the necessary PodMonitor and ServiceMonitor you will need for scrapping istio metrics from workload clusters.
You just have to apply the yaml in both workload clusters in the namespace in which the Prometheus Operator is running:
kubectl apply -f monitoring/monitor.yaml --context="${CTX_CLUSTER1}" -n istio-system
kubectl apply -f monitoring/monitor.yaml --context="${CTX_CLUSTER2}" -n istio-system
Now please generate some load on your istio applications, and test that you are recieving metrics.
If you check on thanos, you should be able to run some queries such as istio_requests_total:
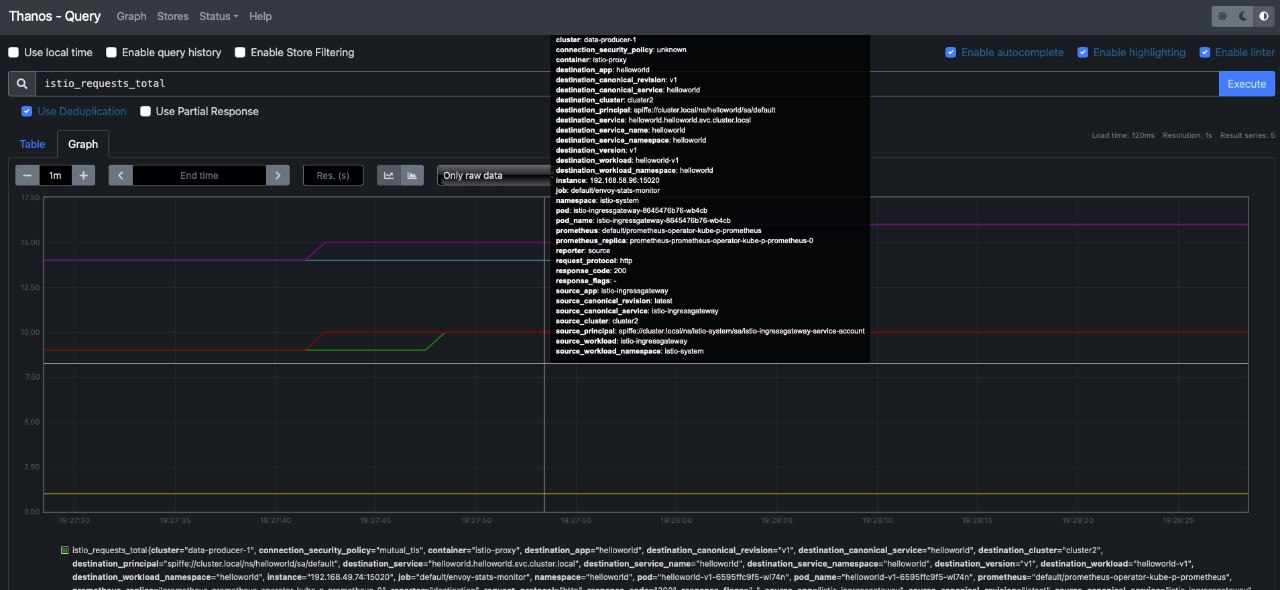
You can also visualize metrics from Grafana:
